Using Google Looker Studio to review your http to https migration

I wanted to see if I could use Google Looker Studio (formally Google Data Studio) to report on site migrations from http to https
The four different variants of your website — http, https, www and non www — are seen as different websites by Google. Technically you can actually run different content under each of these, though it is very unusual to see that. As such we need to ensure that all four variants are created as properties in Google Search Console (GSC)..
When you migrate from http to https your http GSC chart will dip and your https chart will rise. However, the data for each is on a different GSC Property and you cannot see what is happening on a single chart in GSC. You can group together those properties in a Set and even then you can only compare individual URLs. In the new GSC you cannot combine properties into Sets, though there have been hints that in 2019 we might see some advances in this area.
Google started migrating reports over to the new look Google Search Console (GSC) in 2018. At some point in 2019 they will probably close down the old GSC leaving you no way of monitoring a migration. That leaves us with a bit of a hole for what’s happening with our site.

Google Looker Studio to the rescue!
Since the June 2018 Google Looker Studio (at the time named Google Data Studio). has had the ability to blend data into one data set allowing you to show the different data from each of the blended sets.
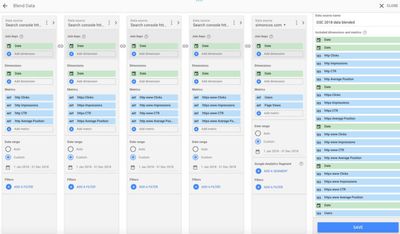
I used this to build a GDS dashboard for GSC. It is a bit fiddly as everything in each set is named the same and I could not see any indicators of which dataset was in the blend metrics — so I wrote down the order that I added the data sets into the blend. These are the steps I took: (there was a lot of trial and error on the way!)
- Ensured all four variants of my site were in GSC
- Added all four variants of the site into Looker Studio as data sources
- Created a blended data source using the date as the Joining Key — this is the primary piece of data that allows Google Looker Studio to reconcile the data — the date is an obvious Joining Key though you can use any field that is common to all data sources!
- Rename each Metric by clicking the left element and rename so you can easily identify each in the chart creation. This is also used as the chart key text and saves time if you do it now.
- Added the data again as the dimension for each site
- Included the Clicks, Impressions, Site CTR and Average Positions data as Metrics for each site
- Set the date span to all of 2018 as I had completed my migration at the end of July
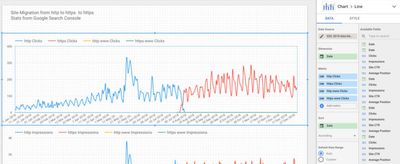
- Created a line chart, set the data source to my Blended data
- Set the four Click fields as metrics — drag and drop!
- Tweak the chart style to bring you some design joyness.
- Rinse and repeat for the other charts.
- Spend the next few days trying to fathom out what’s actually going on now you have these new insights!


Insights
Looking at the data we can quickly see when the http to http migration took place, at the end of July 2018 and it took about a week to roll out.

Two things stood out from this chart. The first was that Google appears to be much happier with the content as https but the second I was not expecting — the volatility of the impressions of the https chart — the peaks and troughs are huge compared to the site when it was http. There was a big Google change in August and I might have been just plain unlucky to relaunch the site when I did!
The Clicks chart, like the Impressions, shows a greater volume of clicks and the same volatility.

A closer study shows that the http pages were still being shown as SERP results for some time as can be seen in the chart. That’s not an issue for me as everything is redirected but shows some interesting behaviour from Google.

In the CTR chart, we can again see the volatility the https site has — and a classic outlier of a high click through rate, in yellow, for the http www site with 5 impressions causing 3 clicks!

A different site
I then tested a different site — one that had not got much love from me last year — to my SEO shame — it had issues as the content was available on all four URL patterns (duplicate content alert)! Fixed late December 2018 when I rebuilt and relaunched the site. Compare this with the charts from my own site — yes there is a peak as it is an event site but the traffic is split between http and https with most of it on the http.

Adding Google Analytics
I did go a step further and introduced a fifth data source — maximum of five in Google Data Studio blends — and that was the sites Google Analytics. As I write though it is only showing the analytics from the migration date so I will have to do some more prodding and poking to work out what’s going on. It could be I need to pull that data into a Google sheet and add it that way but for now, this is mission accomplished.

And there is more...
2019 01 03:
I edited the article today after I realised that re-naming the Metric fields at the blended data level meant that the names were pulled through into the chart and made chart creation a lot easier than renaming the metrics fields in the charts and for the chart key!
2019 01 05:
Resources Update — should have included these when I wrote this article but — fuddled head.
Other resources
I wanted to point to some other superb resources on the subject of using Google Search Console in Google Looker Studio:
- For a fantastic breakdown on using Google Data Studio, you must read Using Google Data Studio for a more actionable Google Search Console Performance Dashboard. by the brilliant and lovely Aleyda Solis. This is a really thorough introduction to using Google Search Console Data in Google Data Studio and Aleyda has a template available that I also use.
- A great write up on how to export GSC data through GDS — Use Google Data Studio to Export Google Search Console Data by Date. from Mr Jonathan Jones which I have also used and is super useful!
- A solid introduction from Omi Sido Google Data Studio – The complete guide. — wish I had read this before jumping in as it would have saved me a lot of trial and error!
2019 01 28: Another update!
Hamlet Batista has written up a great article using data merge techniques following this article for a merger migration: SEO: Monitoring Traffic from Domain Mergers, with Google Data Studio. — worth a read!
Next post: Pludgebanging words into Google
Previous post: A scratch-built rail-bus for the Ding Dong Moor Railway


